

 Română
 English
 Deutsch
 Magyar
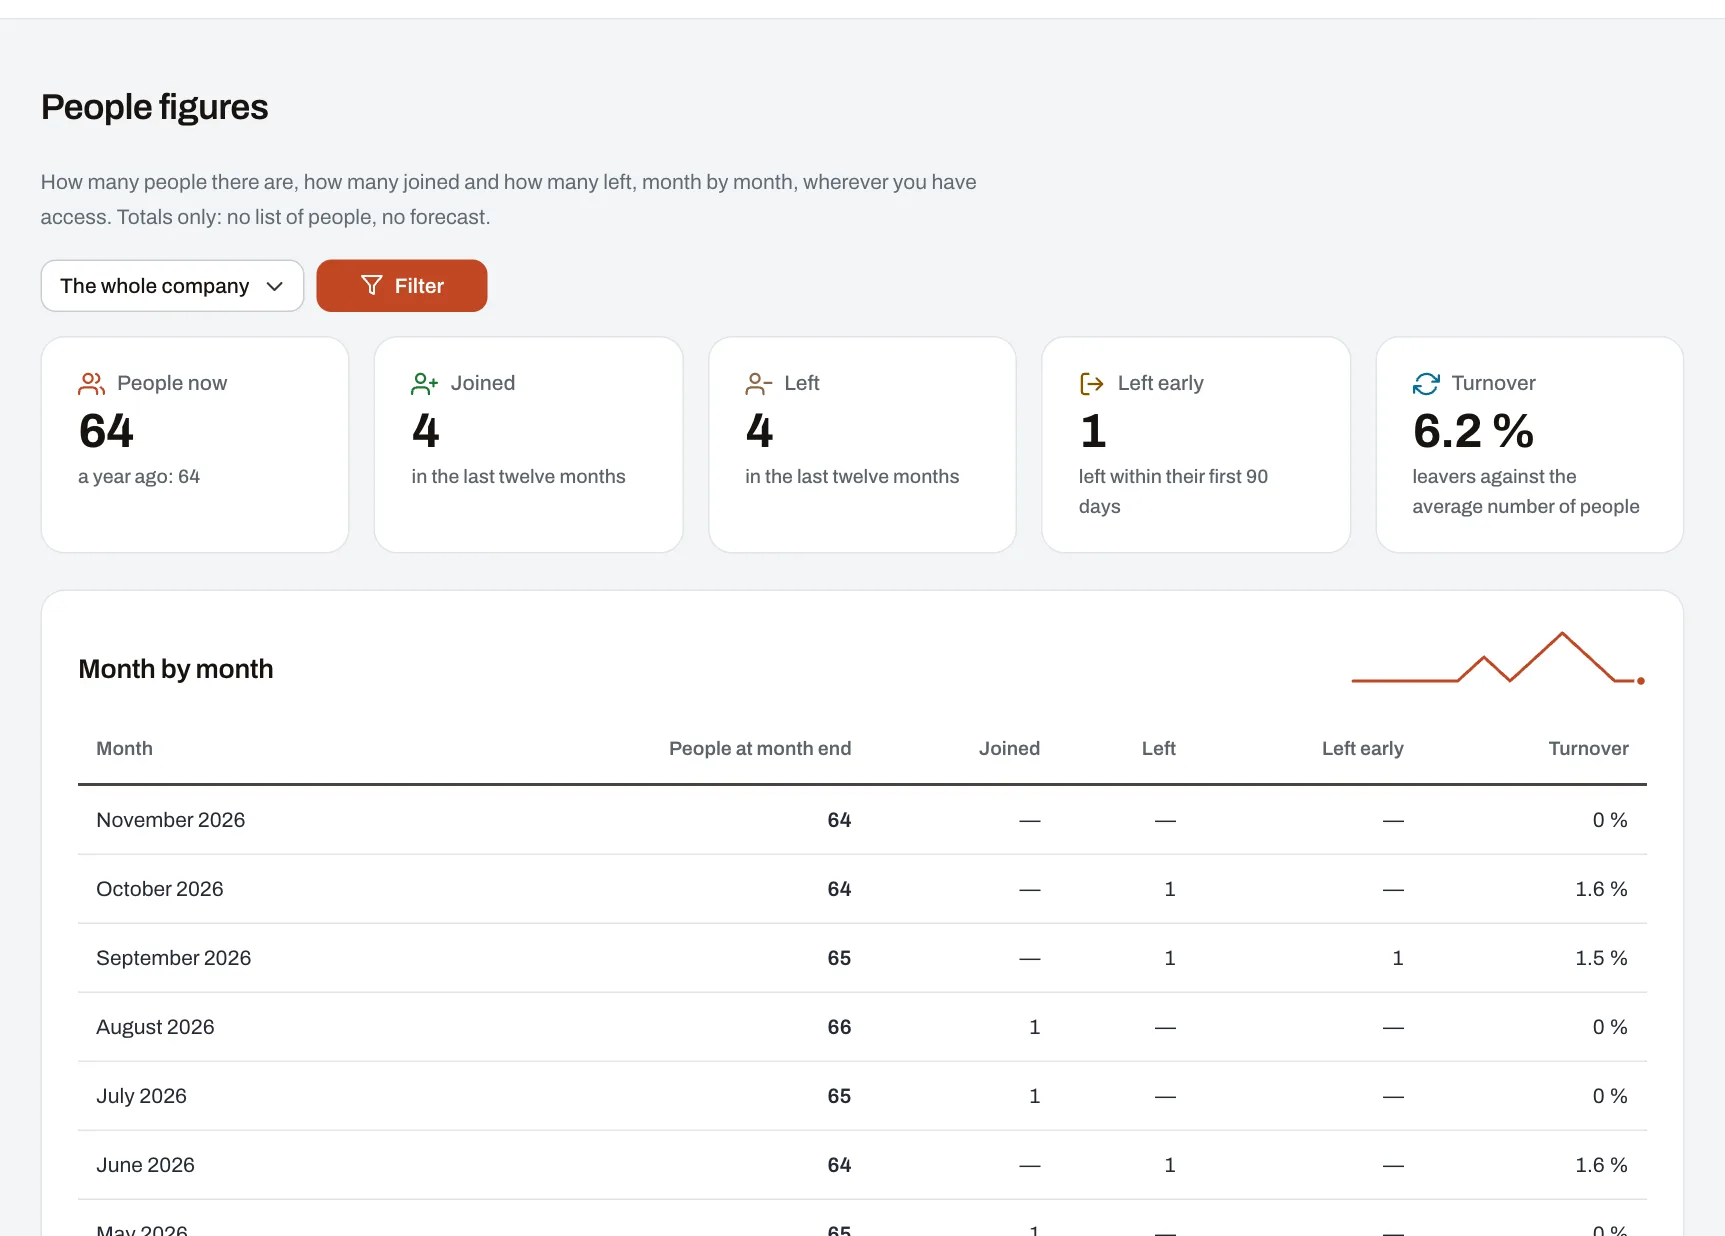
“How many people did we lose this year, and where?” is a question HR usually answers with a hand-made spreadsheet. In People figures the answer is up to date, for the whole company or for an area, a unit or a department.
What it shows
- Twelve months, month by month: how many people there were at the end, how many joined, how many left, how many of them left within their first 90 days, and turnover.
- Turnover, explained: leavers against the average number of people in the period.
- Tenure and age groups for today’s people.
- The same figures as on the scorecards: a person counts where their primary placement was that month, and the “People” metrics can also go into scores.
Totals only
- No list of people and no forecast.
- A tenure or age group is shown only from your company’s minimum group size; if just one would be hidden, the smallest of the others is hidden too, so nobody can be worked out by subtraction.
Who sees what
- HR with company-wide access chooses the company, an area, a unit or a department.
- Managers see their own units.
- The monthly figures can also be downloaded from Reports, per unit in your reach.
Which plan
Every plan.