

 Română
 English
 Deutsch
 Magyar
You received a lower score than you expected, and meanwhile the evaluation formula has changed. The practical question is how many points come from your results and how many from the new rule. This page helps you separate the two: a simulator applies the same values under two sets of weights and shows each indicator’s contribution to the difference, and a checklist gathers the documents and questions for the conversation with your manager or HR.
The simulator calculates a difference. It does not decide whether the change is lawful or fair, or whether you are owed a particular bonus.
Quick answer. Keep the normalised values unchanged and calculate the score once with the old weights and once with the new ones: the difference between the two scores is the effect of the change in weights alone. Then check separately the other three places where a formula can change: the raw results, the normalisation and the level thresholds. Ask for both versions of the rules, and the date they were communicated, in writing.
Four places where a formula can change
An evaluation formula turns a period’s results into a score. On the way it passes through four stages, and a change can happen in any of them, not only in the weights. If you compare only the final score, you cannot tell what has changed.
The raw result is the measured figure: 141,000 lei in sales, a 12-minute response time, 3 complaints. Normalisation means bringing the results onto a common scale, usually achievement against target as a percentage, so they can be added up. The weight says how much each indicator counts in the total. The level threshold turns the score into a label, for example “Meets expectations” or “Above expectations”.
| Stage changed | Example | How you recognise it | What the simulator does |
|---|---|---|---|
| Raw results | Sales are now reported without returns | The same month shows a different figure in the report | Nothing: enter the corrected values and compare separately |
| Normalisation | The target rose from 150,000 to 165,000 lei; achievement is capped at 120% | The same raw figure gives a different percentage | Nothing: first calculate the percentage under each rule |
| Weights | Target achievement drops from 70% to 30% | The same percentages, a different total | Calculates the exact difference and each indicator’s contribution |
| Level thresholds | “Above expectations” starts at 105 instead of 100 | The same score, a different label | Nothing: compare the score with both sets of thresholds |
The guide on choosing KPI indicators explains the target, the score and normalisation in detail. Here we are only concerned with how to isolate a change.
The simulator: same values, different weights
The simulator makes a controlled comparison: it keeps the normalised values and changes only the weights. Enter the indicators, their scale, the value and the two weights. The example below is loaded from the start; you can replace it with your own data.
Simulator: same values, different weights
Compares two sets of weights applied to the same normalised values and shows how much of the score difference comes from the change of rule. It does not compare arbitrary formulas, does not apply level thresholds and does not say which weight is right.
What you write here stays in this browser: it is not sent and not saved on the site.
The result
score with the original weights
score with the new weights
points difference, same values
| Indicator | Value | Original contribution | New contribution | Difference |
|---|---|---|---|---|
| Total |
Some values go above 100: they are kept as you wrote them, without a cap. If the company’s rules cap achievement (for example at 120%), enter the capped value.
Formula: score = sum (normalised value × weight) / 100. We round only for display, to at most two decimal places. The result shows the effect of the weights; it does not say which weight is right and is not a legal interpretation.
The file is created on this device, with the calculation’s formulas (Simulation) and the checklist.
A few of the simulator’s rules, so you know what you are reading. An empty field stays missing and stops the comparison; a zero you type is a real value. Each set of weights must add up to 100%, with a tolerance of 0.01 points, and wrong weights are not quietly corrected. Values above 100 are kept without a cap.
The simulator does not add lei to percentages and minutes. If an indicator is not normalised, the comparison stops and tells you to calculate achievement against target first.
The example worked out step by step
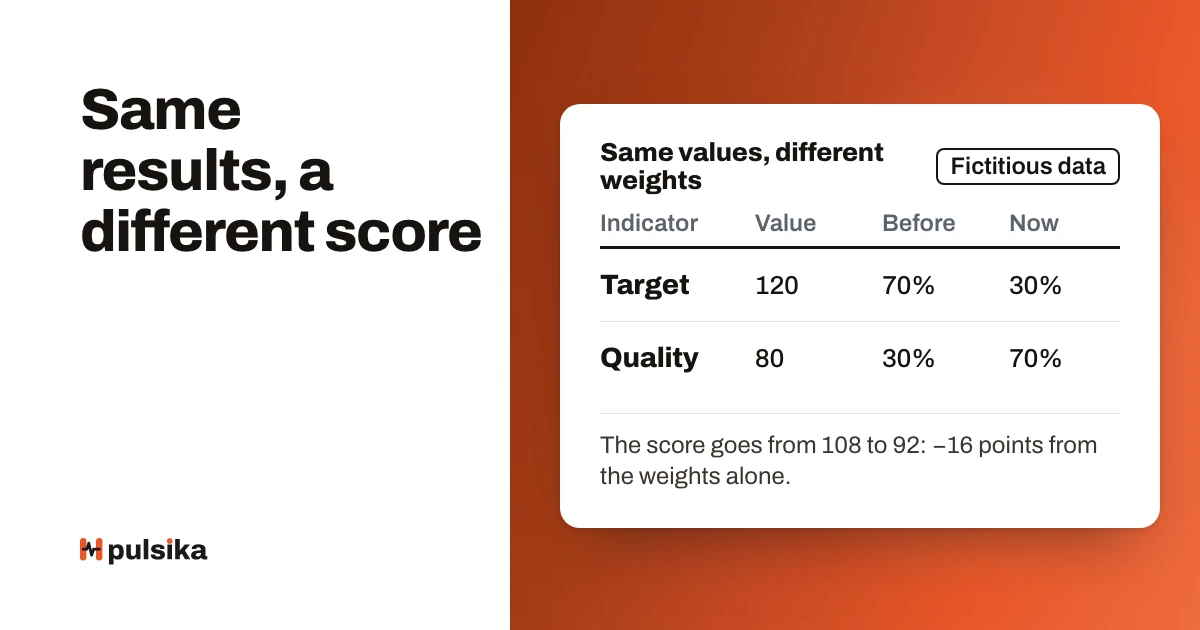
Fictitious data — worked example. An employee has two indicators normalised as achievement against target. The values do not change between the two versions; only the weights change.
| Normalised indicator | Unchanged value | Original weight | New weight |
|---|---|---|---|
| Target achievement | 120 | 70% | 30% |
| Service quality | 80 | 30% | 70% |
- The original score: 120 × 0.70 + 80 × 0.30 = 84 + 24 = 108.
- The new score: 120 × 0.30 + 80 × 0.70 = 36 + 56 = 92.
- The difference: 92 − 108 = −16 points, although no result has changed.
- The contribution of target achievement: 120 × (30 − 70) / 100 = −48. The contribution of quality: 80 × (70 − 30) / 100 = +32.
- The check: −48 + 32 = −16. The contributions always add up to the total difference.
The calculation shows something less visible: a shift in weights matters only through the distance between the values. With two indicators, the difference is (120 − 80) × (30 − 70) / 100 = −16. Had both values been 100, the same shift in weights would not have changed the score at all.
Remember. The example does not prove which weight is “right”. A company may legitimately decide that service counts more than sales. The calculation only shows how much of the score moved because of the decision, so that the conversation starts from figures, not impressions.
If the score also has levels
Suppose, as a hypothesis, that the company uses a threshold of 100 for “Above expectations”. Then 108 would be above the threshold and 92 below it: a change in weights would move the person down one level. The threshold of 100 is only a hypothesis for the example, not a standard. Check the company’s real thresholds and whether they have changed too.
What you can infer and what remains unknown
The comparison is correct only if its assumptions are true. The first assumption is that the normalised values are the same in both versions. If the target has changed as well, do two calculations: first the percentage under each target, then the weights.
The second assumption is that the formula is a simple weighted average. A formula that uses the weakest indicator, a cap on the total or a condition such as “no bonus below 80 on quality” cannot be reduced to weights. For one like that, ask for the full calculation, step by step, as in the guide on scores people trust.
The third assumption concerns missing data. If an indicator has no data in a month, the company’s rule decides what happens: it is set aside, counted as zero or the period is extended. The simulator does not choose for the company; the guide on missing data in evaluation compares the options.
What remains unknown after the calculation: the reason for the change, who approved it, when it applies from and what effect it has on a bonus. You find these out from documents and a conversation, not from a formula.
Correcting an error or changing the rule
A correction means fixing a wrong figure or a calculation applied incorrectly, under the same rule. A rule change alters the formula itself: weights, targets, normalisation or thresholds. The two are handled differently, and the question “which of them happened?” often settles half the discussion.
| Situation | What changed | What to ask for |
|---|---|---|
| Data correction | A value entered wrongly, the same rule | The old value, the new value and the source |
| Calculation correction | The rule was applied incorrectly | The original and the corrected calculation, step by step |
| New rule | Weights, targets, normalisation or thresholds | Both versions, the date of approval and the date of communication |
What Romania’s Labour Code says, in brief
Romania’s Labour Code (Codul muncii, Law no. 53/2003) gives the employer the right to set individual performance objectives and evaluation criteria (Art. 40(1)(f)). The criteria and procedures for professional evaluation are part of the internal regulations (Art. 242(i)). The internal regulations take effect for an employee from the moment the employee has been informed of them (Art. 243(3)); the text is on legislatie.just.ro.
That is why the date of communication is an important line on the checklist. Whether a particular change can apply to a period already evaluated is, however, a legal question about your case. For that, consult a lawyer or an employment law specialist; this page does not settle it.
The checklist and the conversation
The checklist is included in the tool above and is printed or downloaded together with the simulation. Do not upload documents to the site: the checklist stays with you. Fill it in in this order:
- Note the period evaluated and the score you received.
- Identify the document with the original rules: its name, version and date.
- Note the date and the form in which the rules were communicated to you.
- Ask for the final rules applied and the history of changes: what, when and who approved it.
- Gather the source values and check that they are the same in both calculations.
- Calculate the difference with the simulator and enter it on the checklist.
- Ask for a written explanation and note the answer you receive.
The questions on the checklist are worded to open a conversation, not to accuse. What exactly has changed? When does it apply from? Was an error corrected or the rule changed? Who approved it? What effect does the change have on the period already evaluated? How is the evaluation kept separate from the bonus budget?
The last question matters more than it seems. A company can change the bonus budget without changing the evaluation, or the other way round. The guide on bonuses and thresholds shows how the two are linked.
Common mistakes
- Comparing raw results instead of normalised values. Lei, minutes and percentages do not add up. Compare achievement against target, calculated under the same rule.
- Treating an empty field as zero. Missing data is not a poor result. Find out the company’s rule for missing data before you calculate.
- Rebalancing the weights yourself. If the weights you received do not add up to 100%, ask for the correct set; a proportional split you make yourself is an invented rule.
- Confusing a correction with a rule change. A figure corrected under the same formula is not a new rule and is discussed differently.
- Discussing the bonus before the score. Clear up the calculation first; the link to money comes from another rule.
- Reading the difference as proof of bad faith. The difference shows the effect of a decision, not the intention behind it.
Frequently asked questions
Can the employer change the weights in the scorecard?
Romania’s Labour Code gives the employer the right to set performance objectives and evaluation criteria, and the criteria go into the internal regulations, which take effect once the employee has been informed of them. Whether a particular change can apply to a period already evaluated is a legal question for the specific case. For that, consult a lawyer or an employment law specialist.
Why did my score change if my results stayed the same?
The score changed because how much each result counts has changed. A weight moved towards the indicator where your value is lower pulls the total down, even if the figures are identical. In the example on this page, the values 120 and 80 give 108 with the old weights and 92 with the new ones, that is 16 points less.
What does an indicator’s contribution to the difference mean?
The contribution shows how many points of the total difference come from a single indicator. It is calculated as the indicator’s value multiplied by the change in its weight and divided by 100. In the example, target achievement contributes −48 points and quality +32. The contributions always add up to the total difference, so you can check the calculation yourself.
What do I do if the indicators have different units?
First bring them onto the same scale, usually achievement against target as a percentage. Sales in lei are divided by the target, and a response time in minutes is converted under the rule the company has chosen. The normalisation rule is part of the formula, so ask for it explicitly. The simulator refuses the comparison until the values are comparable.
Do an empty field and zero mean the same thing?
No. Zero is a real result, for example no sales in a month. An empty field means the result is not known. Replacing the gap with zero penalises the person for a data problem. The simulator stops the comparison when a value is missing and asks you to decide explicitly what to do with the indicator.
Are values above 100% a mistake?
Not necessarily. If the score measures achievement against target, 120 means the target was exceeded by 20%. Some companies cap achievement, for example at 120, so that a single indicator does not dominate the total. The cap is part of normalisation: if there is one, enter the already capped value in the simulator.
Does the simulator tell me whether the new formula is right?
No. The simulator shows the numerical effect of the change in weights on the same values. Whether a weight is appropriate depends on what the company wants to encourage, on the role and on the data available. The guide on testing a KPI scorecard describes how a formula is checked before launch, on data from past months.
What data leaves my device when I use the simulator?
None of the values you enter. The calculation, the checklist and the downloaded file are made in the browser, with nothing sent to a server and nothing saved on the site. The page counts visits without cookies; only if you have accepted measurement can it also record that you used the example, printed or downloaded, without any value.
Next step
Enter the difference and the questions on the checklist and ask for a conversation with your manager or HR, with both versions of the rules on the table. If the conversation shows that the normalisation or the thresholds have changed too, redo the calculation for each stage, separately.
For those who build scorecards, the guide on testing a KPI scorecard shows how to simulate a formula before launch, and the one on calibrating evaluations discusses adjustments made after the calculation. In Pulsika, a published scorecard can no longer be edited: a change becomes a new version, and every score keeps the version and the values it was calculated with.